20081117

Roadside service for a Commercial Airliner

In the November 2008 issue of Air & Space (Smithsonian) Magazine had an interesting article on Boeing's Aircraft on Ground (AOG) team. The author was able to follow the team as they repaired a Boeing 767 that had been damaged when it had been backed into a jet blast fence and the rear pressure bulkhead had been punctured.

[Air & Space said that they were asked not to disclose whose airliner this was and what airport that this took place at]

Here's a picture from Boeing - showing the vertical stabilizer being put back on (contrary to the caption). If this was the only picture you saw - you wouldn't know that the caption was wrong. I'll explain how I can tell in a minute - the hint is in the lower left hand corner of the picture.

This past weekend on the National Geographic channel - their (HGC) series "World's Toughest Fixes" featured this specific 'fix'. NGC wasn't nearly as shy about saying where this was all taking place. It was in Paris, at Charles DeGaulle airport. The damage occurred on Chrismas Eve (2007).

If you can catch this episode either this week or in repeats - set the Tivo/DVR for it. Its interesting to see what goes into a job like this. If you don't get NatGeo or don't have the time for it - click here - for a quick 2 minute summary of the repair.

Ok - so back to that first picture. The lower left hand corner is a video camera (filming the NGC episode), and the green section of the underside of the fuselage is what gives this picture away as being post-repair. That green section of the fuselage is the section of skin that was replaced as part of the repair.

Also - look at this picture - showing the pressure bulkhead being replaced - the guy on the right in the red hat is the host of "World's Toughest Fixes." You can pick him out because he is the only one with chest pouch/toolkit.

Finally - to answer the question 'whose airliner was this' - I present links to two pictures;
It actually wasn't too hard to find pictures matching this airline livery on-line. The TV show helped somewhat - when they had a close up of the vertical stablizer being put into its temp cradle - you could see what looked like two white birds in flight (in between the red and green fields).

BTW - the airline really wanted to get the plane back in the air. They only have two 767's in service. So while this one was laid up for 3 weeks - they long range fleet was at 1/2 capacity.

20081116

How to - make your own QR Code

[if you watch CSI:NY on CBS, the episode last week featured QR codes on the back of the 'tell all' stationary that was part of the murder investigation]

I have already shown how you can decode a QR code - and now you want to create a QR code of your own. Start by going to the Google Chart API developers guide. In addition to the standard line charts, bar charts, pie charts, Venn diagrams and maps - the Google Chart API also supports QR codes.

You call the API just as you would call any other image that you would link to;

http://chart.apis.google.com/chart?cht=qr&chl=URL:http://www.strongholddigitalservices.com&choe=utf-8&chs=200x200&chld=Q|10
  • Chart AP - http://chart.apis.google.com/chart?
  • Chart type - cht=qr
  • Data to encode - chl=URL:http://www.strongholddigitalservices.com
  • Encoding - choe=utf-8
  • Size (in pixels) - chs=200x200
  • Error correction | margin - chld=H|5
Note - the amount of data will determine how many bits are in the QR code. The size just determines how big the output will be.

The Error correction letter says defines how much of the QR code can be missing or obscured, while still allowing the data to be retrieved. The 'H' code allows up to 30% of the image to be missing or obscured, and still able to maintain the data.

Here are some samples to illustrate the differences.

Size 200x200, Error Correction = H


Size 100x100, Error Correction = H


Size 200x200, Error Correction = L (worst, only 7% error/missing/obscure)

All three images contain the exact same data - but they differ only in size (between 1st and 2nd) and data correction (1st and 3rd).

Now - why has Google gone to such trouble to include the QR code in their Chart library? I don't know for sure - but it happens to be part of their Android mobile phone OS on TMobile's G1 handset. Beyond that - we will have to see if these start showing up and get adopted by more than just the twenty-something's.

20081111

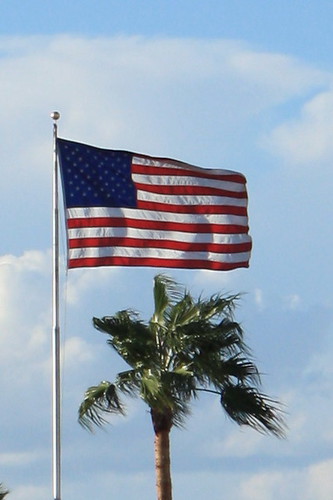
Veterans Day - 2008


Flag in the wind, originally uploaded by rob-the-org.

Don't forget to thank a veteran for their dedication to making the US a better place to live.

20081102

Getting an early start on her technical education

20081030

Get Out and Vote


Get Out and Vote, originally uploaded by videoal.

Yes - this is a real sign - no Photoshop.

This guy is running for state house on the other side of town. Drove past one of these signs a couple of weeks ago when I didn't have my camera. He even ran a couple of TV ads before the primary.

20081022

Minor Challenge results

Last week - I posted two images - one of which is above - and challenged someone to decode it. No one rose to the challenge.

This is a 2-dimensional bar code - in the QR Code format. One of the leading uses of QR Codes is to;

QR Codes storing addresses and URLs may appear in magazines, on signs, buses, business cards or just about any object that users might need information about. Users with a camera phone equipped with the correct reader software can scan the image of the QR Code causing the phone's browser to launch and redirect to the programmed URL.

If your phone isn't set-up to translate the above image - then there are on-line websites available to allow you to decode the image.
  1. Save image to your computer
  2. Go to Zxing decoder online site
  3. Browse to the location of the saved image file (or if the image is posted on-line - you can point the web page to the URL of the image)
  4. Submit query
  5. Decoded text is returned to the web browser as a line of text
Performing that decode on the above QR Code should display the following information;

geo:33.635801,-112.232906

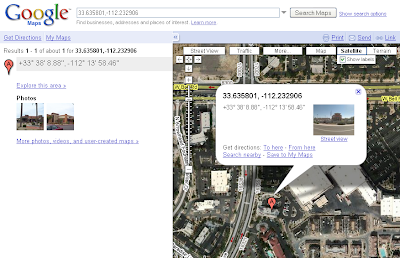
The 'geo:' denotes geographic co-ordinates. So go over and open Google Maps and enter the Co-ordinates (actual lat-long) in the search box at the top.

You should get a image/map (depending on your settings) that looks similiar to this image;


That location - denotes my local Chick-Fil-A. Where you can find me getting breakfast during the week between 9am and 9:15am MST (about 1/2 the time).

Decoding the 2nd barcode is left as an exercise to the reader.

[Next - how to create a QR code of your own]

20081017

So what is BOINC?

Down the right hand side of this blog - is the following graphic;


What this is - is the CPU workunits/progress and standings/statistics about my participation in different BOINC projects. BOINC - stands for 'Berkeley Open Infrastructure for Network Computing'.

Basically - it is a framework under which different distributed applications can be run. When SETI@Home first started - it was its own dedicated application. That would only have a single workunit in process at a time. I have been running SETI@Home since 1999. And from the table above - you can see that it is the project I have my 2nd highest total credit with.

There are a large number of projects that are available, so if searching for ET to phone home isn't your idea of a good use of spare computer cycles - there are plenty of other options.

I look for projects that are contributing to the general good, and not contributing to something that someone can patent and sell (several of the bio-sciences projects were looking for gene mappings or drug interactions - no thanks).

A couple of the newer projects have skipped the idea of a screensaver. And just have a simple logo to display instead. I like the idea of the screensaver - if it pertains to the project. LHC@Home's - just seems to put bouncing balls on the screen that changes color. But when I am running it at work - an interesting screensaver will prompt people to ask what I have running. That curiousity - could ultimately result in another computer or two working on that project.

Every time a work unit for a project is completed - the user's account gets credit for the work done. But - since the dawn of man if you give him a way to compare himself to others - he will find a way to gain an advantage for himself. For some - this can include installing BOINC 'quietly' on extra computers, writing a code module to increase the speed at which a workunit can be completed or even just buying more computers to run.

Now the credit granted to the participants - has gotten controversial. Some sites have revised the credit they grant - downwards. These 'Kredit Kops' - have been trying to get all of the projects to grant credit based on similiar work.

I don't agree with this policy. Let each project set their own limits. That would allow the less popular or mainstream projects give out more credit as a way to attract more participants.

Remember - these are all volunteer projects. The credits are the only thing that the participants get in return for donating their computer cycles (and power bills) to the project's goal.